Statins are the most prescribed lipid-lowering agents for reducing the risk of primary and secondary cardiovascular disease (CVD). With a reduction of low-density lipoprotein-cholesterol (LDL-C) concentration by approximately 1.8 million using statin therapy, the risk of ischemic heart disease falls by 60%, and the risk of stroke by 17%.1 Over the past three decades, evidence for the benefit and safety of statin use has led to updates in lipid-lowering guidelines and treatment choices,2,3 resulting in statin use increasing from 838/100 000 persons in 2003 to 1627/100 000 persons in 2015.4
Despite significant benefits, statin use has risks. Recent data from randomized clinical trials5,6 suggested that statin use could be associated with 10–45% higher risk of new-onset diabetes mellitus (NODM).7 Accordingly, the USA Food and Drug Administration and the European Medicines Agency have warned of a higher risk of diabetes among statin users.8
In view of the recently revised evidence-based guidelines, global statin use is expected to increase even further.9 This will place more such patients at risk for NODM, who will require individualized monitoring and management. The UAE has a high prevalence of dyslipidemia and associated conditions; this is particularly evident among obese and overweight individuals, who form respectively 35% and 32% of the adult Emirati population, with a dyslipidemia prevalence of 44%.10 Additionally, their incidence of CVD is 12.7 per 1000 person-years,11 and that of diabetes is 16.3 per 1000 person-years.12
Most studies on statin-related NODM have been conducted among Euro-American populations, with only a few published from the Middle East.7 This study compared the incidence of NODM among Emirati patients with cardiovascular risks and receiving statin therapy to that of statin nonusers. We investigated the association between statin therapy and incident diabetes, thus adding to the epidemiological data on statin-related NODM in the Gulf region of the Middle East.
Methods
This retrospective observational analytical cohort study was conducted at Tawam Hospital, Al Ain, UAE. The study was ethically approved by the Tawam Human Research Ethics Committee (MF2058-2022-841). Patients’ records and information were anonymized and de-identified at the time of data entry; therefore, the Ethics Committee waived the requirement for informed consent.
Electronic medical records (EMRs) of adult UAE nationals visiting outpatient clinics at the large local tertiary care hospital in Al Ain from 1 April to 31 December 2008, and thereafter followed-up till 31 January 2020, were reviewed during 2022.
The sample size for the study was estimated using a formula prescribed by Rosner.13 An optimal sample size of 300 was determined, based on an assumed 13% incidence of DM,12 using 80% statistical power and a two-sided significance level of 0.05.
The study had the following inclusion criteria: UAE nationals aged ≥ 18 years, with (a) one or more cardiovascular risk factors such as hypertension (systolic blood pressure (SBP) ≥ 140 mmHg, diastolic blood pressure (DBP) ≥ 90 mmHg, or receiving antihypertensive medications); (b) dyslipidemia (receiving statin therapy or having an established diagnosis of dyslipidemia at baseline), overweight (having a body mass index (BMI) of 25.0–29.9 kg/m2), and obesity (BMI ≥ 30 kg/m2); (c) smoking history (current smokers or those with past smoking history were considered smokers), (d) history of coronary heart disease (CHD) (a documented history of a coronary event, coronary revascularization procedure, or a diagnosis established by a cardiologist), (e) history of stroke (a documented history of cerebrovascular accident or transient ischemic attack), (f) documented history of peripheral arterial disease (PAD), and (g) history of chronic kidney disease (defined as an estimated glomerular filtration rate (eGFR) of < 60 mL/min/1.73 m2, as recalculated using the chronic kidney disease-EPI creatinine equation 2021 which incorporates serum creatinine levels).14
Statin therapy was determined by reviewing drug prescriptions and clinicians’ assessment plans as recorded in the EMRs. Patients who were newly prescribed at least one statin medication during the index period and maintained statin therapy for > 90 days, were identified as statin users. Patients with no record of statin therapy use as mentioned above, were considered statin nonusers.
Patients with a diagnosis of DM, on medications for DM, with glycated hemoglobin (HbA1c) ≥ 6.5% prior to the index date, or missing HbA1c baseline data, were excluded. Also excluded were patients who received statin therapy prior to the study entry date. Figure 1 illustrates the selection process.
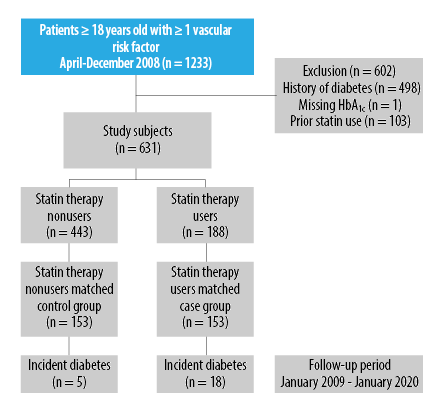 Figure 1: Flowchart of subject selection process.
The following baseline information was collected from the patients’ EMRs for analysis: age, sex, smoking status, family history of DM (defined as a first-degree relative having a history of DM), history of CHD, stroke, and PAD, and clinical parameters, such as BMI, SBP, and DBP. Treatment modalities such as antihypertensive medication and statins and laboratory results such as LDL-C, eGFR, and HbA1c were also collected.
The primary outcome measured was incident diabetes, defined as a follow-up finding of HbA1c level of ≥ 6.5% on at least two separate days, anytime during a patient’s follow-up period. This was ascertained by reviewing patients’ EMRs until 31 January 2020. The date diagnosis of incident diabetes (NODM) was based on the earliest abnormal laboratory test result. The follow-up time for developing NODM was determined for each patient from the index date to the earliest of the following events: the diagnosis of NODM, the last outpatient visit, or the date of 31 January 2020.
Multiple (five) imputations using the predictive mean matching technique were performed for missing data: family history of diabetes had 20.6% missing, LDL-C had 4.4% missing, and creatinine had 1.1% missing, whereas height, weight, SBP, and DBP each had < 1% missing. The missing data occurred at random. Based on this information, imputed datasets were created and utilized in all subsequent analyses. Rubin’s rules were used to combine the results across the imputed datasets.15
Propensity score matching was used to account for variations in baseline characteristics between the statin user group and the statin nonuser group and to construct the matched cohort.16,17 The propensity score was estimated using the multivariable logistic regression model with the statin user group as the dependent variable and the following covariates: age, sex, history of CHD, history of stroke, history of smoking, antihypertensive medication, SBP, DBP, BMI, LDL-C, eGFR, and HbA1c. The nearest neighbor matching algorithm was employed with a 1:1 matching ratio. A caliper width equivalent to 0.2 of the propensity score was used.
In the original unmatched and matched cohorts, the differences in baseline characteristics between statin users and statin nonusers were tested using Fisher’s exact test (two-tailed) for categorical variables, an independent-samples t-test for normally distributed continuous variables, and Mann-Whitney U test for non-normally distributed continuous variables. Normally distributed continuous variables were presented as mean and SD, and non-normally distributed continuous variables as medians and IQRs. Categorical variables were presented as proportions. The age- and sex-adjusted incidence rates of NODM per 1000 person-years for statin and nonstatin users were calculated using Poisson regression.18
The association between incident diabetes and statin use was evaluated by comparing NODM levels in statin users and nonusers using multivariable Cox proportional hazard model, which was adjusted for the following covariates: age, sex, history of smoking, family history of diabetes, SBP, DBP, LDL-C, BMI, and statin use. The results were recorded as hazard ratios (HRs) with 95% CIs.
The number needed to harm (NNH) was considered as the number of patients who must be treated for one of them to experience an adverse reaction because of the therapy. NNH was estimated using the method based on the restricted mean survival time.19 We estimated the impact of unmeasured confounding using the E-value, which is defined as the minimum strength of association that an unmeasured confounder would require to fully explain a specific therapy–outcome association, depending on the measured covariates. A high E-value indicates that substantial unmeasured confounding may be necessary to describe an effect estimate. In contrast, a low E-value suggests that only minimal unmeasured confounding may be sufficient. We conducted our post-estimation sensitivity analysis to assess unmeasured confounding using the E-value package in R software version 4.1.2 (The R Foundation, Vienna, Austria).20
All statistical analyses were performed using SPSS (IBM Corp. Released 2021. IBM SPSS Statistics for Windows, Version 28.0. Armonk, NY: IBM Corp) and R software. Two-sided p-values < 0.05 were considered statistically significant.
Results
The participants of the study were 631 adults with one or more cardiovascular risk factors at baseline [Figure 1]. Among them, the statin group of patients comprised 188 (29.8%). During the index period, they started taking at least one type of statin. The majority (116; 61.7%) were prescribed atorvastatin, followed by rosuvastatin (42; 22.3%), simvastatin (21; 11.2%), pravastatin (6; 0.03%), and fluvastatin (1; 0.005%), as well as two unspecified statins.
There were several differences in the baseline characteristics between the statin user and nonuser groups [Table 1]. Statin users were more likely to be older, female, on blood pressure-lowering medications, and having a history of CHD, than statin nonusers. In addition, statin users had higher BMIs, SBPs, HbA1c levels, and LDL-C levels at baseline than nonusers. Interestingly, statin nonusers had a higher prevalence of a family history of DM (50.8%) than statin users (32.4%). After applying propensity score matching, 153 statin users and 153 nonusers with similar baseline variables were identified.
Table 1: Baseline characteristics of the study cohort stratified by statin medication use (N = 631).
|
Age, years, mean ± SD
|
40.1 ± 15.0
|
56.0 ± 12.9
|
< 0.001*
|
53.6 ± 14.2
|
54.3 ± 12.8
|
0.646
|
|
Male
|
251 (56.7)
|
76 (40.4)
|
< 0.001*
|
64 (41.8)
|
68 (44.4)
|
0.729
|
|
female
|
192 (43.3)
|
112 (59.6)
|
|
89 (58.2)
|
85 (55.6)
|
|
|
Smoking
|
90 (20.3)
|
30 (16.0)
|
0.223
|
26 (17.0)
|
25 (16.3)
|
1.000
|
|
CHD
|
4 (0.9)
|
19 (10.1)
|
< 0.001*
|
4 (2.6)
|
9 (5.9)
|
0.256
|
|
Stroke
|
12 (2.7)
|
9 (4.8)
|
0.224
|
8 (5.2)
|
8 (5.2)
|
1.000
|
|
PAD
|
2 (0.5)
|
3 (1.6)
|
0.160
|
2 (1.3)
|
1 (0.7)
|
1.000
|
|
BP-lowering medication
|
108 (24.4)
|
126 (67.0)
|
< 0.001*
|
87 (56.9)
|
92 (60.1)
|
0.643
|
|
Family history of diabetes
|
225 (50.8)
|
61 (32.4)
|
< 0.001*
|
53 (34.6)
|
54 (35.3)
|
1.000
|
|
BMI, kg/m2, median (IQR)
|
27.8
(24.4–32.0)
|
29.7
(25.8–32.7)
|
0.010*
|
29.9
(26.0–33.6)
|
29.7
(26.0–32.2)
|
0.561
|
|
SBP, mmHg, mean ± SD
|
125.3 ± 16.4
|
130.2 ± 15.4
|
< 0.001*
|
130.7 ± 18.4
|
129.6 ± 16.1
|
0.599
|
|
DBP, mmHg, mean ± SD
|
76.2 ± 11.6
|
76.5 ± 10.7
|
0.782
|
77.7 ± 13.9
|
77.0 ± 11.0
|
0.622
|
|
HbA1c, %, mean ± SD
|
5.5 ± 0.5
|
5.7 ± 0.5
|
< 0.001*
|
5.7 ± 0.4
|
5.7 ± 0.5
|
1.000
|
|
LDL-C, M, mean ± SD
|
3.2 ± 0.8
|
3.5 ± 1.1
|
0.002*
|
3.5 ± 0.9
|
3.5 ± 1.1
|
0.798
|
|
eGFR, mL/min/1.73 m2, median (IQR)
|
114.0
(101.5–124.0)
|
100.5
(87.0–109.0)
|
< 0.001*
|
102.0
(92.0–112.0)
|
103.0
(93.0–109.0)
|
0.556
|
|
Follow-up HbA1c, %, median (IQR)
|
5.5 (5.2–5.8)
|
5.8 (5.5–6.1)
|
|
5.6 (5.4–6.0)
|
5.8 (5.5–6.1)
|
|
|
Statin type
|
|
n = 186
|
|
|
n = 151
|
|
|
Atorvastatin
|
|
116 (62.4)
|
|
|
90 (59.6)
|
|
|
Rosuvastatin
|
|
42 (22.6)
|
|
|
37 (24.5)
|
|
|
Simvastatin
|
|
21 (11.3)
|
|
|
18 (11.9)
|
|
|
Pravastatin
|
|
6 (3.2)
|
|
|
5 (3.3)
|
|
*Significance; CHD: coronary heart disease; PAD: peripheral artery disease; BP: blood pressure; BMI: body mass index; SBP: systolic blood pressure; DBP: diastolic blood pressure; HbA1c: hemoglobin A1c; LDL-C: low-density lipoprotein cholesterol; eGFR: estimated glomerular filtration rate. aMatched cohorts were constructed using propensity score matching.
Patients were followed for a median of 10.1 years (IQR = 7.9–10.9). During the follow-up period, 20 (10.6%) patients in the statin user group developed NODM. The age- and sex-adjusted incidence rate was 26.9 events per 1000 person-years in statin users compared to 8.4 in nonusers, which suggests that statin use may be associated with more than twice the likelihood of developing NODM (with adjusted HR = 2.46, 95% CI: 1.11–5.45; p = 0.027) compared to statins nonusers [Table 2].
Table 2: Incidence rate and hazard ratio (HR) for the association between statin therapy use and the risk of NODM in the original and matched cohorts.
|
Statin users
|
20 (10.6)
|
26.9 (16.0−45.3)
|
2.46
(1.11−5.45)d
|
18 (11.8)
|
21.2
(13.8−32.5)
|
3.24 (1.13−9.26)e
|
NODM: new-onset diabetes; aMatched cohort was constructed using propensity score matching; bAge- and sex-adjusted incidence rate per 1,000 person-years; cCox regression model adjusted for age, sex, history of smoking, family history of diabetes, SBP, DBP, LDL-C, and BMI; dp = 0.027; ep = 0.028.
In the matched cohort also, a significantly higher risk of NODM was associated with the use of statin therapy [Table 2 and Figure 2]. In this cohort, 18 (11.8%) statin users developed NODM. The age- and sex-adjusted incidence rate in statin users was 21.2 events per 1000 person-years versus 8.3 in nonusers. The adjusted HR was estimated to be 3.24 (95% CI: 1.13–9.26; p = 0.028). Figure 2 shows the multivariable-adjusted Cox regression probability curve that indicates a significantly higher rate of NODM occurrence among statin users compared to nonusers over the follow-up period. Furthermore, the likelihood of developing NODM started as early as within one year of initiating statin therapy.
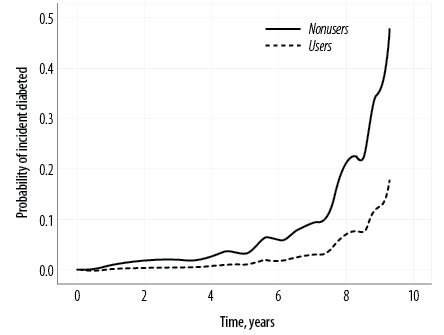 Figure 2: Probability curve from multivariable-adjusted Cox regression analysis, comparing statin therapy users and nonusers in a propensity score-matched cohort.
The finding showed that 19.2 patients (95% CI: 10.9–90.9) in the matched cohort would need to be treated with statins for 10 years for one patient to develop NODM (NNH). As seen in the adjusted Cox regression results of the matched cohort reported in Table 2, the E-values for the point estimate and lower confidence bound for NODM were 5.93 and 1.52, respectively.
Subgroup analyses were conducted to assess the association between statin use and the risk of NODM among the different CVD risk factor subgroups in the matched cohort [Supplemental Table S1]. The age- and sex-adjusted incidence rate was highest among the smoking subgroup (46.4 events per 1000 person-years), followed by the rates in the overweight and obesity subgroup (23.8 events) and the hypertension subgroup (25.8 events).
Discussion
The concern for the risk of diabetes associated with statin use started to emerge around the turn of the 21st century. In 2010, a Lancet meta-analysis, covering 13 large statin trials, estimated that one in 255 patients on statin therapy would develop NODM over a four-year period.21 The same study also estimated that four years of statin use would lower the risk of CVD by a factor of 5.4.21 In comparison, the current study found a higher probability of 1 in 19.2 patients in our matched cohort developing NODM, but over a much longer period of 10 years. In recent years, the development of NODM among statin users has been viewed with concern because diabetes is recognized as a significant risk factor for CVD. This outcome is confined not only to patients using statins in the general population but also to those with CVD.5,21
Our Emirati patients presenting with cardiovascular risk factors and receiving statin therapy had a significantly increased risk of NODM compared to statin nonusers, over a 10-year period. We identified a matched cohort to minimize any bias due to baseline differences between statin users and nonusers. We found that the NODM risk associated with statin therapy was even greater in the matched cohort than in the original cohort of statin users.
Other recent studies also show significantly higher predictive risk of developing NODM among statin users. However, the reported levels of risk vary significantly from our findings and between other populations and countries. For example, studies from the Netherlands and Korea showed respectively 38% and 66% higher risk among statin users.22,23 Two meta-analyses reported risk levels of 44% and 61% for incident diabetes associated with statin use.24,25 Such variations could be attributed to different research methodologies, diverse study populations,26,27 the use of different statins with differing doses and intensities,6 and varying methods of diagnosing diabetes.28
Multiple trials suggested an increased risk of NODM associated with long-term statin use, as well as higher intensity and cumulative statin dosing, guided the US Food and Drug Administration and the European Medicine Agency to advise caution.6 However, the risk for NODM remains small relative to the significant reduction in CVD events over time. The findings of a recent meta-analysis on randomized controlled trials strongly support that the absolute benefits of statin therapy far outweigh any adverse effects of NODM.6 Additionally, most published data support a decrease in cardiovascular and all-cause mortality among statin users.5,29
Our retrospective observational study of statin-induced diabetes, a first in the UAE, supports and extends previous reports on the evidence showing a risk for developing NODM with statin treatment while adding to the epidemiological information within the Arabian Gulf region.7,30–33 The current evidence validates a low risk for the development of NODM both in absolute terms and when compared to the benefit in CVD event reduction. Based on the above evidence, long-term statin therapy can be recommended for Emiratis with CVD risk factors or those who have been diagnosed with CVD, provided that periodic diabetes screening is also conducted.
There are several limitations to consider when interpreting the findings. First, data on the statin dosages and the changes in statin use and doses over time were not available. Further studies and independent confirmation of the causality between statin usage patterns and NODM in larger clinical trials are warranted. Second, since the data originated from a single site, generalizations of our results should be made with caution. Third, the variability in follow-up intervals among participants may have introduced an attrition bias, potentially impacting the study findings.
Finally, there was a possibility of unmeasured confounding, even though we carefully adjusted for all major risk factors for diabetes and used a matched cohort. However, the possibility of such an unmeasured confounder to counteract the impact of statin use demonstrated in this study was unlikely due to the following reason: our sensitivity analysis using the E-value method indicated that the observed 10-year HR of 3.24 for NODM in the matched cohort could be explained only by an unmeasured confounder that was associated with both statin therapy and NODM risk with a risk ratio of > 5.93. This risk ratio value was found to be greater than that of the diabetes-related risk factors included in our multivariable Cox regression model, as detailed in Supplemental Table S2.
Conclusion
Our results demonstrated an association between statin use and increased NODM risk among Emirati patients with cardiovascular risk or already diagnosed with CVD, aligning with previous research findings and highlighting the importance of pharmacovigilance. Although prior research has confirmed that the benefits of long-term statin therapy significantly outweigh the risks of NODM, it is essential to regularly monitor high-risk patients, especially those with known risk factors for diabetes.
Disclosure
The authors declare no conflicts of interest. No funding was received for this study.
references
- 1. Anand SS. Quantifying effects of statins on low density lipoprotein cholesterol, ischaemic heart disease, and stroke: systematic review and meta-analysis. Vasc Med 2003;8(4):289-290.
- 2. Blais JE, Wei Y, Yap KK, Alwafi H, Ma TT, Brauer R, et al. Trends in lipid-modifying agent use in 83 countries. Atherosclerosis 2021 Jul;328:44-51.
- 3. Said AH, Abd Rahim IS, Mohamad Zaini NN, Saiful Nizam NI. Factors affecting adherence to lipid-lowering drugs: a scoping review. Oman Med J 2023 Jul;38(4):e523.
- 4. Son KB, Bae S. Patterns of statin utilisation for new users and market dynamics in South Korea: a 13-year retrospective cohort study. BMJ Open 2019 Mar;9(3):e026603.
- 5. Wallemacq C. [Statins and new-onset diabetes: benefit-risk balance]. Rev Med Suisse 2019 Aug;15(659):1454-1457.
- 6. Cholesterol Treatment Trialists’ (CTT) Collaboration. Electronic address: ctt@ndph.ox.ac.uk; Cholesterol Treatment Trialists’ (CTT) Collaboration. Effects of statin therapy on diagnoses of new-onset diabetes and worsening glycaemia in large-scale randomised blinded statin trials: an individual participant data meta-analysis. Lancet Diabetes Endocrinol 2024 May;12(5):306-319.
- 7. Alsafar A, Albohamood H, Alluwaym I, Alzakari M, Alobaidi R, Alawadh M, et al. Statin use and the risk of new-onset diabetes mellitus: a retrospective cohort study. Int J Med Dev Countries 2021;5(2):688-694.
- 8. Kim DW, Kim DH, Park JH, Choi M, Kim S, Kim H, et al. Association between statin treatment and new-onset diabetes mellitus: a population based case-control study. Diabetol Metab Syndr 2019 Apr;11(1):30.
- 9. Yerrakalva D, Griffin SJ. Statins for primary prevention in people with a 10% 10-year cardiovascular risk: too much medicine too soon? Br J Gen Pract 2017 Jan;67(654):40-41.
- 10. Razzak HA, Harbi A, Shelpai W, Qawas A. Prevalence and risk factors of cardiovascular disease in the United Arab Emirates. Hamdan Med J 2018;11(3):105-111.
- 11. Al-Shamsi S, Regmi D, Govender RD. Incidence of cardiovascular disease and its associated risk factors in at-risk men and women in the United Arab Emirates: a 9-year retrospective cohort study. BMC Cardiovasc Disord 2019 Jun;19(1):148.
- 12. Regmi D, Al-Shamsi S, Govender RD, Al Kaabi J. Incidence and risk factors of type 2 diabetes mellitus in an overweight and obese population: a long-term retrospective cohort study from a Gulf state. BMJ Open 2020 Jul;10(7):e035813.
- 13. Rosner B. Fundamentals of biostatistics. 7th ed. Boston: Cengage Learning, Inc; 2010. p. 381-389.
- 14. Inker LA, Eneanya ND, Coresh J, Tighiouart H, Wang D, Sang Y, et al; Chronic Kidney Disease Epidemiology Collaboration. New creatinine- and cystatin C-based equations to estimate GFR without race. N Engl J Med 2021 Nov;385(19):1737-1749.
- 15. Rubin DB. Multiple imputation for nonresponse in surveys. Hoboken, NJ: John Wiley & Sons, Inc; 1987.
- 16. Yang JY, Webster-Clark M, Lund JL, Sandler RS, Dellon ES, Stürmer T. Propensity score methods to control for confounding in observational cohort studies: a statistical primer and application to endoscopy research. Gastrointest Endosc 2019 Sep;90(3):360-369.
- 17. Rosenbaum PR, Rubin DB. The central role of the propensity score in observational studies for causal effects. Biometrika 1983;70(1):41-55.
- 18. Benichou J, Palta M. Rates, risks, measures of association and impact. In: Ahrens W, Pigeot I, editors. Handbook of epidemiology. Springer Berlin Heidelberg; 2005. p. 89-156.
- 19. Yang Z, Yin G. An alternative approach for estimating the number needed to treat for survival endpoints. PLoS One 2019 Oct;14(10):e0223301.
- 20. Linden A, Mathur MB, VanderWeele TJ. Conducting sensitivity analysis for unmeasured confounding in observational studies using E-values: the evalue package. Stata J 2020;20(1):162-175.
- 21. Sattar N, Preiss D, Murray HM, Welsh P, Buckley BM, de Craen AJ, et al. Statins and risk of incident diabetes: a collaborative meta-analysis of randomised statin trials. Lancet 2010 Feb;375(9716):735-742.
- 22. Ahmadizar F, Ochoa-Rosales C, Glisic M, Franco OH, Muka T, Stricker BH. Associations of statin use with glycaemic traits and incident type 2 diabetes. Br J Clin Pharmacol 2019 May;85(5):993-1002.
- 23. Lee SE, Sung JM, Cho IJ, Kim HC, Chang HJ. Risk of new-onset diabetes among patients treated with statins according to hypertension and gender: results from a nationwide health-screening cohort. PLoS One 2018 Apr;13(4):e0195459.
- 24. Casula M, Mozzanica F, Scotti L, Tragni E, Pirillo A, Corrao G, et al. Statin use and risk of new-onset diabetes: a meta-analysis of observational studies. Nutr Metab Cardiovasc Dis 2017 May;27(5):396-406.
- 25. Kamran H, Kupferstein E, Sharma N, Karam JG, Myers AK, Youssef I, et al. Statins and new-onset diabetes in cardiovascular and kidney disease cohorts: a meta-analysis. Cardiorenal Med 2018;8(2):105-112.
- 26. Chung J, Kim HL, Lim WH, Seo JB, Zo JH, Kim MA, et al. New onset diabetes mellitus and cardiovascular outcomes according to statin intensity in patients after drug-eluting stent implantation in Asian patients. Sci Rep 2023 Sep;13(1):16061.
- 27. Kim TJ, Lee JS, Yoon JS, Oh MS, Kim JW, Park SH, et al. The impact of statin treatment duration on the risk of new-onset diabetes mellitus and recurrent vascular events in ischemic stroke patients: a linked data analysis. Cerebrovasc Dis 2024 Mar:1-9.
- 28. Lee J, Noh Y, Shin S, Lim HS, Park RW, Bae SK, et al. Impact of statins on risk of new onset diabetes mellitus: a population-based cohort study using the Korean national health insurance claims database. Ther Clin Risk Manag 2016 Oct;12:1533-1543.
- 29. Chou R, Dana T, Blazina I, Daeges M, Jeanne TL. Statins for prevention of cardiovascular disease in adults: evidence report and systematic review for the US preventive services task force. JAMA 2016 Nov;316(19):2008-2024.
- 30. Zigmont VA, Shoben AB, Lu B, Kaye GL, Clinton SK, Harris RE, et al. Statin users have an elevated risk of dysglycemia and new-onset-diabetes. Diabetes Metab Res Rev 2019 Nov;35(8):e3189.
- 31. Beckett RD, Schepers SM, Gordon SK. Risk of new-onset diabetes associated with statin use. SAGE Open Med 2015 Oct 27;3:205031211560551.
- 32. Bang CN, Okin PM. Statin treatment, new-onset diabetes, and other adverse effects: a systematic review. Curr Cardiol Rep 2014 Mar;16(3):461.
- 33. Chrysant SG. New onset diabetes mellitus induced by statins: current evidence. Postgrad Med 2017 May;129(4):430-435.