Anemia is a multifactorial, pervasive, extra-articular manifestation that is a significant burden in rheumatoid arthritis (RA).1,2 The most common types of anemia in RA are chronic anemia and iron-deficiency anemia. Several existing studies observed anemia in 24.0–70.6% of patients with RA.3–12 Low Hb concentrations in patients with RA have been associated with increased mortality, extensive physical disability, and disease activity.2,3,13 Inversely, replenishing Hb levels in anemia was associated with improved quality of life in RA.8 Previous studies have classified anemia in RA according to the World Health Organization as Hb < 130 g/L in males and Hb < 120 g/L in females.3–12,14,15 However, a paucity of studies created a standardized low cut-off Hb value for anemia irrespective of gender. Additionally, there are scant data regarding the prevalence, clinical, and laboratory characteristics of patients with anemia and RA in Kuwait. We aimed to stratify patients with RA residing in Kuwait based on low and high Hb values to assess the prevalence and ascertain the association between demographics, treatment characteristics, and disease activity.
Methods
Patients with RA and Hb reports were analyzed retrospectively using information collected from the Kuwait Registry for Rheumatic Diseases (KRRD). The registry design and methodology were previously delineated in detail.16 In brief, KRRD is a prospective, national registry for adult patients diagnosed with rheumatic disease in four Kuwaiti government hospitals. Hospitals are established in different governorates to ensure ethnic diversity. Patients with RA are referred to government hospitals to undergo treatment, as medicine is inexpensive for Kuwaitis and expensive for non-Kuwaitis. The study recruitment was conducted from February 2013 to February 2022.
Baseline, demographic, clinical, and laboratory data (i.e., disease activity and treatment) were obtained. Nurses and rheumatologists who were trained to fill standard manuals or electronic forms collected the data. Data storage was secured through a safe digital program which connected the four hospitals. The Ethics Committee of the Ministry of Health in Kuwait (Letter No. VDR/JC/882 dated 10.10.2012) approved the study. Informed written consent was taken from all patients.
RA was defined and classified according to the American College of Rheumatology criteria.17 Our study defined adults with anemia as low Hb (≤ 110 g/L) and adults without anemia as high Hb (> 110 g/L). We defined Disease Activity Score-28 (DAS-28) ≥ 3.2 as moderate/severe disease activity, and DAS-28 < 3.2 as low disease activity/remission; the values were calculated using a DAS calculator.18
The measurement of serological data was standardized across laboratories in the participating hospitals. Immunoglobulin (Ig) M rheumatoid factor (RF) measurement was obtained quantitatively by nephelometry, and a count of > 20 was positive. Anti-nuclear antibodies (ANAs) were evaluated by indirect immunofluorescence using the Hep-2 cell line, and a titre > 1:40 was positive. Anti-cyclic citrullinated peptide antibodies were assessed by enzyme-linked immunosorbent assay, and values ≥ 20 U/mL were considered positive. Although tofacitinib is a targeted synthetic disease-modifying antirheumatic drugs (DMARDs), it is included here under biologics, given its high efficacy in treating RA, similar to biologics.19 The work has been reported in line with the STROCSS criteria.20
We stratified our cohort into two groups according to their Hb scores: high Hb (non-anemic) and low Hb (anemic). Skewed continuous variables, medians, and IQR were performed using the Mann-Whitney U test. Categorical variables were expressed as frequencies and percentages and compared using the chi-square (χ2) test. Finally, logistic regression analysis was applied to examine the association between Hb groups and the following covariates: sex, nationality, age at RA onset, white blood cell count, creatinine level, erythrocyte sedimentation rate (ESR), C-reactive protein (CRP), DAS-28 groups (DAS-28 ≥ 3.2 and DAS-28 < 3.2), treatment (biologics and DMARDs), patient global assessment, physician global assessment, and tender and swollen joints. Statistical significance was set at p < 0.05. The dataset was analyzed using JAMOVI (Version 2.3.18) and SPSS (IBM Corp. Released 2021. IBM SPSS Statistics for Windows, Version 28.0. Armonk, NY: IBM Corp).
Results
The total number of patients visited (Nv) was 11 393 and the number of consecutive patients with RA diagnoses and Hb data (Np) was 1584. Both Nv and Np were included in the study. Table 1 summarizes the demographic characteristics of patients with RA stratified by Hb levels. The average age of the patients was 55.9 ± 12.5 years and 63.4% were female. The analysis revealed significant differences in the mean age of the patients in the high (56.4 ± 12.6) and low (54.9 ± 12.1 years) Hb groups. The average age at RA onset in the low Hb group was significantly less (10.3 ± 6.2 years) compared to patients with high Hb (11.3 ± 7.0 years). Among those with high Hb, the majority were Kuwaitis (51.7%), whereas in the low Hb group, the prevalence was non-Kuwaitis (54.2%). Moreover, the analysis revealed no significant differences among the Hb groups in terms of body mass index, sex, and smoking status.
Table 1: Demographic characteristics of rheumatoid arthritis (RA) cohort stratified by Hb levels.
|
Age, mean ± SD, years
|
55.9 ± 12.5
|
56.4 ± 12.6
|
54.9 ± 12.1
|
0.0191
|
|
Duration of RA, mean ± SD, years
|
11.0 ± 6.8
|
11.3 ± 7.0
|
10.3 ± 6.2
|
0.0071
|
|
Sex: female
|
1004 (63.4)
|
665 (63.2)
|
339 (63.8)
|
0.7882
|
|
BMI, mean ± SD, kg/m2
|
30.0 ± 12.5
|
30.0 ± 13.0
|
30.1 ± 11.1
|
0.8491
|
|
Nationality
|
|
|
|
0.0272
|
|
Kuwaitis
|
787 (49.7)
|
544 (51.7)
|
243 (45.8)
|
|
|
Non-Kuwaitis
|
797 (50.3)
|
509 (48.3)
|
288 (54.2)
|
|
Hb: hemoglobin; Np: total number of patient.; BMI: body mass index.; 1Linear model ANOVA; 2Pearson's chi-squared test.
Table 2 outlines the association between Hb levels and the baseline medical characteristics. Notably, in the high Hb group, 25.2% (Np = 265) of the patients had positive ANA, while the patients with low Hb had markedly less positive ANA (19.0%, Np = 101). The other baseline medical characteristics showed no significant differences between the two Hb groups.
Table 2: Baseline medical characteristics of rheumatoid arthritis cohort stratified by Hb levels.
|
Secondary Sjogren’s
|
247 (15.6)
|
175 (16.6)
|
72 (13.6)
|
0.2181
|
|
Rheumatoid Nodules
|
33 (2.1)
|
20 (1.9)
|
13 (2.4)
|
0.4081
|
|
Positive RF
|
1118 (70.6)
|
745 (70.8)
|
373 (70.2)
|
0.5721
|
|
Anti-CCP positive
|
819 (51.7)
|
538 (51.1)
|
281 (52.9)
|
0.6281
|
Hb: hemoglobin; Np: total number of patients; RF: rheumatoid factor; Anti-CCP: anti–cyclic citrullinated peptide; ANA: antinuclear antibodies; 1Pearson’s chi-squared test.
Table 3 highlights the results of the DMARDs among the Hb groups. The low Hb group was prescribed leflunomide (17.6% vs. 13.0%; p < 0.001), hydroxychloroquine (30.4% vs. 27.5%; p = 0.002), and cyclophosphamide (0.3% vs. 0.0%; p < 0.001). In contrast, patients with high Hb levels were more commonly prescribed methotrexate (65.2% vs. 61.9%; p < 0.001).
Table 3: DMARDs regimen among rheumatoid arthritis cohort stratified by Hb levels.
|
MTX
|
7322 (64.3)
|
5384 (65.2)
|
1938 (61.9)
|
< 0.0011
|
|
SSZ
|
1501 (13.2)
|
107 (13.0)
|
424 (13.5)
|
0.4861
|
|
LEF
|
1623 (14.2)
|
1070 (13.0)
|
551 (17.6)
|
< 0.0011
|
|
HCQ
|
3222 (28.3)
|
227 (27.5)
|
952 (30.4)
|
0.0021
|
|
IMUR
|
208 (1.8)
|
138 (1.7)
|
70 (2.2)
|
0.0451
|
DMARDs: disease-modifying antirheumatic drugs; Hb: hemoglobin; Nv: total number of patients visit; MTX: methotrexate; SSZ: sulfasalazine; LEF: leflunomide; HCQ: hydroxychloroquine; IMUR: azathioprine; CYC: cyclophosphamide; 1Pearson’s chi-squared test.
Table 4 presents the results of the biological regimen between the Hb groups. A higher proportion of patients with low Hb levels were prescribed adalimumab (7.2% vs. 5.8%; p = 0.005), infliximab (5.2% vs. 3.9%; p = 0.003), tofacitinib (1.7% vs. 0.9%; p <0.001), certolizumab (2.3% vs. 1.1%; p < 0.001), and golimumab (1.0% vs. 0.3%; p < 0.001). A higher proportion of patients with high Hb levels were prescribed rituximab (12.5% vs. 9.3%; p < 0.001), tofacitinib tocilizumab (20.1% vs. 10.3%; p < 0.001), and abataceptdalimumab (7.5% vs. 5.8%; p = 0.002). Overall, a higher proportion of the high Hb group received biologics than low HB group (57.2% vs. 50.0%; p < 0.001) and a higher proportion of the low Hb group received DMARDs than high Hb group (50.0% vs. 42.8%; p < 0.001).
Table 4: Biologics regimen among rheumatoid arthritis cohort stratified by Hb levels.
|
Medications
|
|
|
|
|
|
RIT
|
1319 (11.6)
|
1029 (12.5)
|
290 (9.3)
|
< 0.0011
|
|
ADA
|
707 (6.2)
|
480 (5.8)
|
227 (7.2)
|
0.0051
|
|
TOC
|
1983 (17.4)
|
1660 (20.1)
|
323 (10.3)
|
< 0.0011
|
|
ETA
|
515 (4.5)
|
355 (4.3)
|
160 (5.1)
|
0.0631
|
|
ABA
|
802 (7.0)
|
619 (7.5)
|
183 (5.8)
|
0.0021
|
|
INF
|
486 (4.3)
|
324 (3.9)
|
162 (5.2)
|
0.0031
|
|
TOF
|
124 (1.1)
|
71 (0.9)
|
53 (1.7)
|
< 0.0011
|
|
CER
|
161 (1.4)
|
88 (1.1)
|
73 (2.3)
|
< 0.0011
|
|
GOL
|
54 (0.5)
|
24 (0.3)
|
30 (1.0)
|
< 0.0011
|
|
Treatment
|
|
|
|
< 0.0011
|
|
Biologics
|
6125 (55.3)
|
4629 (57.2)
|
1496 (50.0)
|
|
Hb: hemoglobin; Nv: total number of patients visit; RIT: rituximab; ADA: adalimumab; TOC: tocilizumab; ETA: etanercept; ABA: abatacept; INF: infliximab; TOF: tofacitinib; CER: certolizumab pegol; GOL: golimumab; DMARDs: disease-modifying antirheumatic drugs; 1Pearson’s chi-squared test.
The results of the laboratory tests in the cohort are summarized in Table 5. The analysis revealed higher values in the low Hb group for ESR, CRP, and platelet count (p < 0.001). Conversely, higher values were found in the high Hb group for aspartate aminotransferase, alanine transaminase, alkaline phosphatase, total cholesterol, low-density cholesterol, and uric acid (p < 0.001).
Table 5: Findings of laboratory test in rheumatoid arthritis cohort stratified by Hb levels.
|
ESR, mm/hr
|
|
23.0 (10.0–40.0)
|
22.0 (10.0–38.0)
|
26.0 (11.0–48.0)
|
< 0.0011
|
|
CRP, mg/L
|
|
4.7 (2.0–8.9)
|
4.3 (2.0–8.2)
|
5.0 (2.0–9.0)
|
< 0.0011
|
|
WBC, × 109/L
|
|
6.9 (5.4–8.6)
|
6.9 (5.4–8.6)
|
6.9 (5.4–8.6)
|
0.7931
|
|
Hb, g/L
|
|
123.0 (107.0– 134.0)
|
129.0 (121.0– 138.0)
|
14.5 (12.2–101.0)
|
< 0.0011
|
|
PLT, × 109/L
|
|
264.0 (216.0–321.0)
|
261.0 (214.0–316.0)
|
273.0 (220.0–338.0)
|
< 0.0011
|
|
Creatinine, µmol/L
|
|
59.0 (51.0–70.0)
|
60.0 (51.0–70.0)
|
59.0 (50.0–71.0)
|
0.1921
|
|
FBS, mmol/L
|
|
5.5 (5.0–6.3)
|
5.5 (5.0–6.3)
|
5.4 (5.0–6.4)
|
0.1201
|
|
AST, U/L
|
|
20.0 (17.0–26.0)
|
21.0 (17.0–26.0)
|
20.0 (16.0–24.0)
|
< 0.0011
|
|
ALT, U/L
|
|
19.0 (14.0–26.0)
|
19.0 (15.0–26.0)
|
19.0 (14.0–24.0)
|
< 0.0011
|
|
ALP, U/L
|
|
64.0 (50.0–80.0)
|
65.0 (51.0–81.0)
|
58.0 (45.0–76.8)
|
< 0.0011
|
|
TC, mmol/L
|
|
4.8 (4.2–5.5)
|
4.9 (4.2–5.6)
|
4.7 (4.0–5.4)
|
< 0.0011
|
|
LDL, mmol/L
|
|
2.8 (2.3–3.4)
|
2.9 (2.3–3.5)
|
2.7 (2.0–3.3)
|
< 0.0011
|
Hb: hemoglobin; Nv: total number of patients visit; ESR: erythrocyte sedimentation rate; CRP: C-reactive protein; WBC: white blood cells; PLT: platelet (thrombocyte) count; FBS: fasting blood glucose; AST: aspartate aminotransferase; ALT: alanine transaminase; ALP: alkaline phosphatase; TC: total cholesterol; LDL: low-density cholesterol; UA: uric acid; 1Mann–Whitney–Wilcoxon test.
Logistic regression analysis examined clinical and demographic variables [Table 6]. Data demonstrated a significant association between Hb levels and nationality [OR = 0.745, 95% CI: 0.643–0.862; p < 0.001), age at RA diagnosis [OR = 0.974, 95% CI: 0.965–0.984; p < 0.001), ESR [OR = 1.006, 95% CI: 1.003–1.009; p < 0.001), DAS-28 levels [OR = 0.738, 95% CI: 0.607–0.896; p = 0.002], DMARDS and biologics treatment [OR = 1.171, 95% CI: 1.011–1.355; p = 0.035], patient global assessment [OR = 0.926, 95% CI: 0.880–0.975; p = 0.004), physician global assessment [OR = 1.073, 95% CI: 1.007–1.143; p = 0.029], tender joints [OR = 0.968, 95% CI: 0.950–0.987; p < 0.001], and swollen joints [OR = 1.107, 95% CI: 1.075–1.139; p < 0.001).
Table 6: Multiple logistic regression analysis of factors associated with DAS-28 in rheumatoid arthritis cohort.
|
Intercept
|
-0.570
|
0.163
|
-3.503
|
< 0.001*
|
0.566
|
0.411
|
0.778
|
|
Gender
|
-0.033
|
0.061
|
-0.538
|
0.591
|
0.968
|
0.859
|
1.090
|
|
Nationality
|
-0.295
|
0.075
|
-3.937
|
< 0.001*
|
0.745
|
0.643
|
0.862
|
|
Duration of RA, years
|
-0.026
|
0.005
|
-5.221
|
< 0.001*
|
0.974
|
0.965
|
0.984
|
|
WBC, × 109/L
|
0.000
|
0.000
|
0.719
|
0.472
|
1.000
|
1.000
|
1.000
|
|
Creatinine, µmol/L
|
0.001
|
0.001
|
0.982
|
0.326
|
1.001
|
0.999
|
1.003
|
|
ESR, mm/hr
|
0.006
|
0.002
|
3.852
|
< 0.001*
|
1.006
|
1.003
|
1.009
|
|
CRP, mg/L
|
0.003
|
0.006
|
0.474
|
0.635
|
1.003
|
0.991
|
1.015
|
|
DAS-28 < 3.2 and DAS-28 ≥ 3.2
|
-0.304
|
0.099
|
-3.068
|
0.002*
|
0.738
|
0.607
|
0.896
|
|
DMARDS and biologics
|
0.158
|
0.075
|
2.111
|
0.035*
|
1.171
|
1.011
|
1.355
|
|
Patient global assessment
|
-0.076
|
0.026
|
-2.918
|
0.004*
|
0.926
|
0.880
|
0.975
|
|
Physician global assessment
|
0.070
|
0.032
|
2.185
|
0.029*
|
1.073
|
1.007
|
1.143
|
|
Number of tender joints
|
-0.033
|
0.010
|
-3.330
|
< 0.001*
|
0.968
|
0.950
|
0.987
|
DAS-28: Hb: hemoglobin; RA: rheumatoid factor; WBC: white blood cells ; DMARDS: disease-modifying antirheumatic drugs; SE: standard error; Z: z-value; DMARD: disease-modifying antirheumatic drugs; +Estimate represents the log odds of low Hb (Hb ≤ 110 g/L) vs. high Hb (Hb > 110 g/L); *p-value is significant.
Table 7 shows the relationship between demographic and clinical parameters stratified by Hb levels using univariate and multivariate analyses. Univariate analysis revealed that sex, nationality, age at RA diagnosis, creatinine, ESR, CRP, DAS-28 levels, treatment, patient global assessment, physician global assessment, tender joints, and swollen joints were significantly associated with Hb levels. Multivariate logistic regression analysis confirmed the association of nationality, age at diagnosis, ESR, CRP, DAS-28 levels, treatment, patient global assessment, physician global assessment, tender joints, and swollen joints with Hb. Figure 1 illustrates how the adjusted odds ratio (aOR) corresponds to the demographic and clinical parameters for the dependent variable Hb. A larger number of non-Kuwaiti patients had lower Hb levels than their Kuwaiti counterparts [aOR = 1.34, 95% CI:1.16–1.56; p < 0.001]. Patients who received biologics were more likely to have high Hb levels [aOR = 1.33, 95% CI:1.23–1.45; p < 0.001). Additionally, patients with DAS-28 ≥ 3.2 were more likely to have low Hb levels than patients with DAS-28 < 3.2 [aOR = 0.74, 95% CI: 0.61–0.90; p = 0.002).
Table 7: Univariable and multivariable logistic regression analysis of factors associated with DAS-28 in the rheumatoid arthritis cohort (version 2).
|
Sex, male
|
3103 (73.7)
|
1106 (26.3)
|
0.91 (0.83–0.99); p = 0.025*
|
0.97 (0.86–1.09); p = 0.591
|
|
Nationality, non-Kuwaiti
|
3099 (68.0)
|
1456 (32.0)
|
1.45 (1.33–1.57); p < 0.001*
|
1.34 (1.16–1.56); p < 0.001*
|
|
Age at RA onset, years, mean ± SD
|
11.9 ± 6.8
|
10.6 ± 6.6
|
0.97 (0.96–0.98); p < 0.001*
|
0.97 (0.96–0.98); p < 0.001
|
|
WBC, mean ± SD
|
33.3 ± 431.4
|
59.3 ± 1273.7
|
1.00 (1.00–1.00); p = 0.166
|
1.00 (1.00–1.00); p = 0.472
|
|
Creatinine, mean ± SD
|
62.1 ± 24.6
|
64.1 ± 35.8
|
1.00 (1.00–1.00); p =0.001*
|
1.00 (1.00–1.00); p = 0.326
|
|
ESR, mean ± SD
|
26.4 ± 20.7
|
32.6 ± 26.6
|
1.01 (1.01–1.01); p < 0.001*
|
1.01 (1.00–1.01); p < 0.001*
|
|
CRP, mean ± SD
|
5.8 ± 4.9
|
6.3 ± 5.1
|
1.02 (1.01–1.03); p < 0.001*
|
1.00 (0.99–1.02); p = 0.635
|
|
DAS-28 groups
|
|
|
|
|
|
DAS-28 ≥ 3.2
|
2212 (65.9)
|
1145 (34.1)
|
|
Reference
|
|
DAS-28 < 3.2
|
6045 (75.3)
|
1988 (24.7)
|
0.64 (0.58–0.69); p < 0.001*
|
0.74 (0.61–0.90); p = 0.002*
|
|
Treatment
|
|
|
|
|
|
Biologics
|
4629 (75.6)
|
1496 (24.4)
|
|
Reference
|
|
DMARDS
|
3465 (69.9)
|
1494 (30.1)
|
1.33 (1.23–1.45); p < 0.001*
|
1.17 (1.01–1.35); p = 0.035*
|
|
Patient global assessment, mean ± SD
|
1.6 ± 2.3
|
1.8 ± 2.4
|
1.03 (1.02–1.05); p < 0.001*
|
0.93 (0.88–0.97); p = 0.004*
|
|
Physician global assessment, mean ± SD
|
1.0 ± 1.7
|
1.2 ± 1.9
|
1.08 (1.06–1.11); p < 0.001*
|
1.07 (1.01–1.14); p = 0.029*
|
|
Tender joints, mean ± SD
|
2.7 ± 5.4
|
3.4 ± 6.0
|
1.02 (1.01–1.03); p < 0.001*
|
0.97 (0.95–0.99); p = 0.001*
|
DAS-28: Disease Activity Score-28; Hb: hemoglobin; aOR: adjusted odds ratio; aP-value: adjusted p-value; *adjusted p-value is significant; RA: rheumatoid factor; WBC: white blood cells; ESR: erythrocyte sedimentation rate; CRP: C-reactive protein; DMARD: disease-modifying antirheumatic drugs.
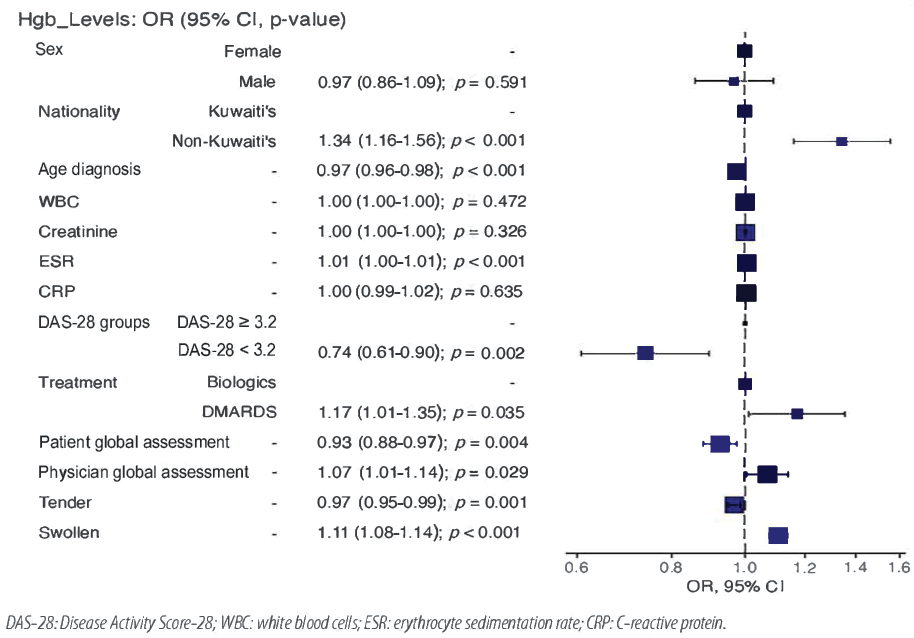 Figure 1: Odds ratio (OR) plot of dependent and independent variables.
Discussion
We examined the clinical impact of RA stratified by Hb levels in the KRRD cohort. The average age in the cohort was 55.9 ± 12.5 years, 63.4% were females, and 50.3% were non-Kuwaiti. The median Hb levels in the groups without anemia and with anemia were 129.0 g/L and 14.5 g/L, respectively. Most patients with positive ANA results were non-anemic (25.2% vs. 19.0%). Regarding treatment, a higher proportion of non-anemic patients received biologics (57.2% vs. 50.0%), unlike anemic patients who were prescribed more DMARDs (42.8% vs. 50.0%). Non-Kuwaitis had 1.34 increased odds of having anemia compared to Kuwaitis. Patients who received biologics had 1.17 increased odds of having normal Hb levels. In addition, patients with DAS-28 ≥ 3.2 had 0.74 increased odds of having anemia in comparison to patients with DAS-28 < 3.2. Non-Kuwaiti patients may have used fewer biologics; hence, they may have a higher DAS-28.19
The anemic syndrome has been previously reported as a marker of high activity and severity in patients with RA.3,21 Table 8 compares our KRRD cohort with other international studies to evaluate the severity of the disease.6–12 All studies included lower Hb level thresholds for females. The AMU study had the lowest cut-off Hb values (< 110 g/L in females and < 120 g/L in males).11 Most studies adhered to the Hb concentrations proposed by the World Health Organization.6,8–10,12 Our study is the sole study to exclude sex and use a generalized low cut-off score. International data have reported that 24.0-70.6% of patients with RA have anemia [Table 8]. The prevalence of anemia in our study was 27.5%, approximately fourfold lower than that reported by Agrawal et al,7 (70.6%), Goyal et al,10 (67.8%), and Ganna (64.0%).9 This was akin to the Swiss Clinical Quality Management study (24.0%) and the Moroccan QUEST-RA study (28.8%).6,8 All the studies agreed that anemic patients had higher DAS-28 scores and a larger number of tender and swollen joints. These studies reported a negative correlation between Hb concentration and DAS-28 and the number of swollen/tender joints. Similarly, in our study, more anemic patients had a DAS-28 ≥ 3.2 than non-anemic patients (36.5% vs. 26.8). Furthermore, patients with anemia had a higher prevalence of swollen (1.2 ± 3.0 vs. 0.5 ± 2.0) and tender joints (3.4 ± 6.0 vs. 2.7 ± 5.4). Our study had lower averages for swollen and tender joints than other international studies.7,9-12
Table 8: Comparison of KRDD and other international studies.
|
SCQM,6 Switzerland
|
1996–2007
|
4377
|
1054 (24.0)
|
F < 120; M < 130
|
5.2 ± 1.5 vs. 4.2 ± 1.4
|
-
|
-
|
|
Agrawal et al,7 India
|
2003
|
214
|
151 (70.6)
|
F ≤ 110; M ≤ 120
|
5.19 ± 1.50 vs. 3.82 ± 1.36
|
8.81 ± 8.08 vs. 3.82 ± 5.77
|
5.37 ± 6.32 vs. 2.23 ± 4.27
|
|
Moroccan QUEST-RA,8 Morocco
|
2008–2010
|
1032
|
297 (28.8)
|
F < 120; M < 130
|
5.45 ± 1.55 vs. 4.7 ± 1.69
|
-
|
-
|
|
Ganna,9 Ukraine
|
2014
|
89
|
57 (64.0)
|
F < 120
|
5.2 ± 1.3 vs. 2.8 ± 1.1
|
28.67 ± 9.01 vs. 16.53 ± 8.27
|
31.42 ± 10.07 vs. 18.52 ± 11.28
|
|
Goyal et al,10 India
|
2012–2013
|
59
|
40 (67.80)
|
F < 120; M < 130
|
3.2-5.1 = 20.0% vs. 80.0%
> 5.1 = 92.0% vs. 8.0%
|
9.17 ± 3.82 vs. 2.35 ± 0.93
|
12.98 ± 4.21 vs. 5.82 ± 2.10
|
|
AMU,11 China
|
2015–2018
|
890
|
418 (47.05)
|
F < 110; M < 120
|
5.80 ± 1.09 vs. 4.80 ± 1.32
|
8 (4–12) vs. 5 (2–10)
|
12 (7–20) vs. 8 (4–15)
|
|
RIMS,12 India
|
2018– 2020
|
236
|
139 (58.9%)
|
F < 120; M < 130
|
4.71 ± 1.25 vs. 1.14 ± 1.15
|
6.17 ± 4.27 vs. 2.91 ± 2.52
|
3.71 ± 3.21 vs. 0.123 ± 0.1
|
RA: rheumatoid arthritis; Hb: hemoglobin; DAS-28: Disease Activity Score-28; SCQM: Swiss clinical quality management; QUEST-RA: Quantitative Standard Monitoring Patients with RA; AMU: Anhui Medical University; RIMS: Regional Institute of Medical Sciences; KRDD: Kuwait Registry for Rheumatic Diseases; M: male; F: female; Nv: total number of patients visit; Np: total number of patients.
Patients with anemia tend to have elevated inflammatory acute-phase reactants compared to their non-anemic counterparts. A previous analysis of 2120 patients with RA demonstrated CRP and ESR to be predictors of anemia.22 In our study, anemic patients were associated with 1.01 increased odds of elevated ESR, but CRP was not significant. The treatment of disease activity and inflammation is believed to improve Hb levels.23 However, long-term DMARDs therapy is associated with abnormal absorption of iron and vitamin B12 as a consequence of gastrointestinal mucosal damage or ulcers.11,24 Emerging data reports tumor necrosis factor is significantly higher in anemic patients with RA.25 Correspondingly, biologics, such as tocilizumab and adalimumab, have been associated with significant improvements in anemia.26,27 We did not study Hb concentration before drug administration; thus, we could not ascertain any improvements due to biologic use. However, there is an association between biologics and normal Hb levels in patients.
As this was a retrospective study, bias could be introduced through confounding variables that were unaccounted for, such as history of nonsteroidal anti-inflammatory and glucocorticoid drug use. Moreover, the etiology and hematological features of anemia were not identified. In our study, stratification was done according to Hb levels and not as per the definition of anemia. Furthermore, we did not delineate the changes in Hb concentration before and after treatment. Further studies are required to overcome these limitations.
Conclusion
The results establish an interrelation between inflammation and anemia, expressed by the significant association between low Hb levels, higher DAS-28 scores, and ESR. Taken together, these results suggest that low Hb levels is a predictor of worse outcomes in patients with RA.
Disclosure
The authors declared no conflicts of interest. No funding was received for this study.
references
- Michaud K, Wolfe F. Comorbidities in rheumatoid arthritis. Best Pract Res Clin Rheumatol 2007 Oct;21(5):885-906.
- Han C, Rahman MU, Doyle MK, Bathon JM, Smolen J, Kavanaugh A, et al. Association of anemia and physical disability among patients with rheumatoid arthritis. J Rheumatol 2007 Nov;34(11):2177-2182.
- Furst DE, Chang H, Greenberg JD, Ranganath VK, Reed G, Ozturk ZE, et al. Prevalence of low hemoglobin levels and associations with other disease parameters in rheumatoid arthritis patients: evidence from the CORRONA registry. Clin Exp Rheumatol 2009;27(4):560-566.
- Wilson A, Yu HT, Goodnough LT, Nissenson AR. Prevalence and outcomes of anemia in rheumatoid arthritis: a systematic review of the literature. Am J Med 2004 Apr;116(Suppl 7A):50S-57S.
- Al-Ghamdi A, Attar SM. Extra-articular manifestations of rheumatoid arthritis: a hospital-based study. Ann Saudi Med 2009;29(3):189-193.
- Möller B, Scherer A, Förger F, Villiger PM, Finckh A; Swiss Clinical Quality Management Program for Rheumatic Diseases. Anaemia may add information to standardised disease activity assessment to predict radiographic damage in rheumatoid arthritis: a prospective cohort study. Ann Rheum Dis 2014 Apr;73(4):691-696.
- Agrawal S, Misra R, Aggarwal A. Anemia in rheumatoid arthritis: high prevalence of iron-deficiency anemia in Indian patients. Rheumatol Int 2006 Oct;26(12):1091-1095.
- Hajar TL, Rostom S, Hari A, Lahlou R, Bahiri R, Abouqal R, et al. Prevalence of anemia and its association with parameters of rheumatoid arthritis patients: a study from the Moroccan Quest - RA data. J Palliat Care Med 2015;5(221):2.
- Smyrnova G. [The relationship between hemoglobin level and disease activity in patients with rheumatoid arthritis]. Rev Bras Reumatol 2014;54(6):437-440.
- Goyal L, Shah PJ, Yadav RN, Saigal R, Agarwal A, Banerjee S. Anaemia in newly diagnosed patients of rheumatoid arthritis and its correlation with disease activity. J Assoc Physicians India 2018 May;66(5):26-29.
- Chen YF, Xu SQ, Xu YC, Li WJ, Chen KM, Cai J, et al. Inflammatory anemia may be an indicator for predicting disease activity and structural damage in Chinese patients with rheumatoid arthritis. Clin Rheumatol 2020 Jun;39(6):1737-1745.
- Devi TS, Sailo S, Reema N, oKhruomo V, Naorem S. Prevalence of anemia in rheumatoid arthritis and its correlation with disease activity. IOSR J Dent Med Sci 2020;19(12):27-32.
- Weiss G, Goodnough LT. Anemia of chronic disease. N Engl J Med 2005 Mar;352(10):1011-1023.
- Kaltwasser JP, Kessler U, Gottschalk R, Stucki G, Möller B. Effect of recombinant human erythropoietin and intravenous iron on anemia and disease activity in rheumatoid arthritis. J Rheumatol 2001 Nov;28(11):2430-2436.
- World Health Organization. Haemoglobin concentrations for the diagnosis of anaemia and assessment of severity. 2011 [cited 2024 August 29]. Available from: https://www.who.int/publications/i/item/WHO-NMH-NHD-MNM-11.1.
- Al-Herz A, Al-Awadhi A, Saleh K, Al-Kandari W, Hasan E, Ghanem A, et al. A comparison of rheumatoid arthritis patients in Kuwait with other populations: results from the KRRD registry. British Journal of Medicine and Medical Research 2016;14(9):1-11.
- Aletaha D, Neogi T, Silman AJ, Funovits J, Felson DT, Bingham CO III, et al. 2010 Rheumatoid arthritis classification criteria: an American college of rheumatology/European league against rheumatism collaborative initiative. Arthritis Rheum 2010 Sep;62(9):2569-2581.
- Jensen Hansen IM, Asmussen Andreasen R, van Bui Hansen MN, Emamifar A. The reliability of disease activity score in 28 joints-C-reactive protein might be overestimated in a subgroup of rheumatoid arthritis patients, when the score is solely based on subjective parameters: a cross-sectional, exploratory study. J Clin Rheumatol 2017 Mar;23(2):102-106.
- Al-Herz A, Saleh K, Al-Awadhi A, Al-Kandari W, Hasan E, Ghanem A, et al; Kuwait Registry for Rheumatic Diseases (KRRD). Accessibility to biologics and its impact on disease activity and quality of life in patients with rheumatoid arthritis in Kuwait. Clin Rheumatol 2021 May;40(5):1759-1765.
- Agha R, Abdall-Razak A, Crossley E, Dowlut N, Iosifidis C, Mathew G; STROCSS Group. STROCSS 2019 guideline: strengthening the reporting of cohort studies in surgery. Int J Surg 2019 Dec;72:156-165.
- Borah DJ, Iqbal F. Anemia in recent onset rheumatoid arthritis. JK Science 2007;9(3):120-122.
- Wolfe F, Michaud K. Anemia and renal function in patients with rheumatoid arthritis. J Rheumatol 2006 Aug;33(8):1516-1522.
- Mahmoud AA, Ismail MA. Anemia, Iron status and calcium-phosphorus levels in rheumatoid arthritis pations. Nature and Science 2012;10(7):110-114.
- Moreland LW, Curtis JR. Systemic nonarticular manifestations of rheumatoid arthritis: focus on inflammatory mechanisms. Semin Arthritis Rheum 2009 Oct;39(2):132-143.
- Kullich W, Niksic F, Burmucic K, Pöllmann G, Klein G. [Effects of the chemokine MIP-1alpha on anemia and inflammation in rheumatoid arthritis]. Z Rheumatol 2002 Oct;61(5):568-576.
- Hashimoto M, Fujii T, Hamaguchi M, Furu M, Ito H, Terao C, et al. Increase of hemoglobin levels by anti-IL-6 receptor antibody (tocilizumab) in rheumatoid arthritis. PLoS One 2014 May;9(5):e98202.
- Sakthiswary R, Syahrul Sazliyana S, Mohd Shahrir MS, Shahril NS, Hussein H. Beyond the joints in rheumatoid arthritis: effects of adalimumab on hematologic and lipid indices. EXCLI J 2012 Apr;11(1):142-149.