Thalassemia is a significant public health issue in Malaysia, with current estimates indicating that 6.8% of Malaysians are thalassemia carriers, affected by varying degrees of anemia.1 Alpha (α) thalassemia results from deletions or non-deletion mutations within the α-globin gene complex, leading to decreased or absence of α-globin chain production.2
Hemoglobin Constant Spring (Hb CS) is the most prevalent non-deletion α-thalassemia among the Southeast Asian population.3,4 In Malaysia, the frequency is higher among Malays (2.24%) than Chinese and Indians (0.66% and 0.16%, respectively).5,6 Hb CS involves a TAA>CAA base pair substitution in the terminal codon of the α2 globin gene, resulting in the elongation of the α chain by an additional 31 amino acid residues.7 The unstable nature of Hb CS mRNA leads to decreased synthesis of normal α-globin.
Heterozygous Hb CS generally presents with normal clinical and hematological features, while homozygous Hb CS may manifest as thalassemia intermedia with mild anemia, jaundice, and hepatosplenomegaly.8 However, the interaction of the Hb CS gene with deletion- α-thalassemia is a leading cause of non-deletion Hb H (β4) (--/αcsα), a more severe form than deletion α-thalassemia, with some patients becoming transfusion-dependent.7
Routine laboratory tests often miss Hb CS, particularly in the heterozygote state, due to its instability and low concentration because Hb CS is unstable and presents at a low level in peripheral blood.9 In this study, the diagnosis of Hb CS was determined using automated capillary electrophoresis (CE), which is believed to be superior to high-performance liquid chromatography (HPLC) to detect the Hb CS trait. In CE, this Hb will give a peak at zone 2 (Hb C/Hb CS zone). Another common variant that also shares the same peak is Hb Pakse. In HPLC, Hb CS gives a very small peak at the C window with a retention time of 4.90–5.30 minutes.10 However, in our previous experience using HPLC, sometimes there was no peak seen in this region for heterozygotes, which may lead to misdiagnosis. The gold standard for diagnosis is still based on molecular analysis, which is costly and tedious.3 In Malaysia, only a few centers offer these molecular tests.
This study aimed to determine the prevalence of Hb CS among the Kelantan population, compare the different levels of Hb CS detected by CE for three groups of Hb CS (heterozygous, homozygous, and compound heterozygous), and determine the efficacy of CE and HPLC method for detection of Hb CS. Understanding the prevalence of Hb CS and its interaction with other hemoglobinopathies is crucial for developing effective prevention, control programs, and treatment plans.
Methods
This study utilized secondary data from the thalassemia registry at the hematology laboratory of Hospital Raja Perempuan Zainab II (HRPZ II) from 2017 to 2018. Study subjects were Form Four students from various secondary schools in Kelantan who participated in the thalassemia screening program conducted by the Ministry of Health, Malaysia. Blood samples were taken in EDTA containers and sent for Hb analysis in HRPZ II. This study was approved by the Medical Research and Ethics Committee of the Ministry of Health, Malaysia (approval number NMRR-18-3787-44516 (IIR)) and Universiti Sains Malaysia Research Committee (USM/JEPeM/18120785). The sample size of 376 was calculated based on one-way ANOVA using G-Power software. A total of 13 895 samples was sent for Hb analysis during the study period and 835 showed a peak in zone 2 CE. However, only 378 samples were randomly chosen for DNA analysis due to budget constraints.
Hemoglobinopathy was quantified and identified using an automated CE system (CAPILLARYS 2 Flex-Piercing System Sebia) and HPLC (VARIANT II, Bio-Rad Laboratories, Hercules, CA, USA). Samples were analyzed within 24 hours, first with HPLC followed by CE according to the manufacturer’s instructions. HPLC separates molecules with net positive charges into different fractions through adsorption onto a negatively charged static phase in a chromatography column. Hb molecules were optically identified in the eluate, provisionally distinguished by their retention time, and measured by the area under the peak after separation. The Sebia Capillarys 2 system, software version 6.2, separates charged molecules at alkaline pH by their electrophoretic mobility, electrolyte pH, and electroosmotic flow. Quality control was monitored using Hb A2 commercial control materials (Sebia).
Samples were outsourced to a reference molecular laboratory for DNA analysis. In Malaysia, the molecular laboratory at Hospital Kuala Lumpur is the central laboratory offering DNA analysis for both deletion and non-deletion α-thalassemia. Multiplex gap polymerase chain reaction was used for common deletion α-thalassemia, identifying α-gene deletions (e.g., single gene deletion: -α3.7 and -α 4.2; and double gene deletions: --SEA, --FIL, --MED, -(α)20.5, and --THAI). For non-deletion α-thalassemia, a multiplex amplification refractory mutation system polymerase chain reaction-based method identified point mutations at the initiation codon, codon 30, codon 35 (Hb Evora), codon 59 (Hb Adana), codon 125 (Hb Quang Sze), and the termination codon (Hb CS, TAA→CAA).
Statistical analysis was conducted using SPSS (IBM Corp. Released 2019. IBM SPSS Statistics for Windows, Version 26.0. Armonk, NY: IBM Corp.) The peak value of zone 2 on CE was analyzed using an independent t-test comparing heterozygous Hb CS and compound heterozygous Hb CS. Data were presented as mean (SD) with a p-value < 0.05 considered statistically significant. The correlation between CE and HPLC was determined using the Pearson’s correlation coefficient test. The strength of the association between the two variables was based on the correlation coefficient (r) value. The study design, from data collection to data analysis, is depicted in Figure 1.
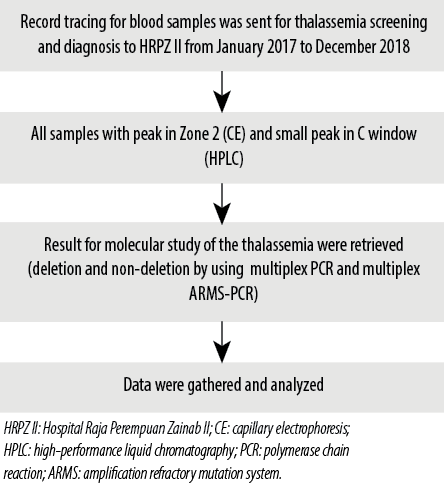 Figure 1: Flowchart showing the study design on detecting hemoglobin Constant Spring by capillary electrophoresis and high-performance liquid chromatography.
Results
A convenient sampling of 835 samples that showed peaks in zone 2 of CE was included in this study. The target group of participants was teenagers. The majority of participants were aged 16 years old (n = 442; 52.9%), followed by 15-year-old (n = 391; 46.8%) and 17-year-old (n = 2; 0.2%). There were 457 (54.7%) females and 378 (45.3%) males. The majority of the ethnic groups included were Malays (n = 829; 99.3%), with the remaining participants being Chinese (n = 3; 0.4%) and Siamese (n = 3; 0.4%) [Table 1].
Table 1: Demographic data (N = 835).
|
Age, years
|
|
15
|
391 (46.8)
|
|
16
|
442 (52.9)
|
|
17
|
2 (0.2)
|
|
Gender
|
|
Male
|
457 (54.7)
|
|
Female
|
378 (45.3)
|
|
Ethnic group
|
|
Malay
|
829 (99.3)
|
|
Chinese
|
3 (0.4)
|
Of the 835 samples showing a peak in zone 2 CE, 378 were randomly chosen for DNA analysis. Hb CS was confirmed in 376 samples, with two samples showing normal results. Among the Hb CS cases, 344 samples were heterozygous Hb CS (91.5%), 31 were compound heterozygous Hb CS (8.2%), and one sample was homozygous Hb CS (0.3%) [Table 2]. The level of Hb CS in heterozygotes ranged from 0.3% to 1.1%, whereas in the compound heterozygous, it ranged from 0.2% to 1.6%. A level of 4.9% was seen in the homozygous Hb CS sample [Table 3].
Table 2: Types of hemoglobin Constant Spring based on molecular analysis (N = 376).
|
Heterozygous
|
344 (91.5)
|
|
Homozygous
|
1 (0.3)
|
Table 3: Mean and range of zone 2 peak on capillary electrophoresis (CE) for different types of Hb
CS (N = 376).
|
Heterozygous Hb CS
|
344
|
0.6 ± 0.1
|
0.3–1.1
|
< 0.001
|
|
Homozygous Hb CS
|
1
|
4.9*
|
4.9*
|
|
Hb CS: hemoglobin Constant Spring;*no SD because of constant value, only one participant in this group; ap-value significant at p < 0.001; independent t-test CE.
The 31 compound heterozygous Hb CS samples were further divided into Hb CS with 3.7 deletion, Hb CS with 4.2 deletion, Hb CS with concurrent Hb E, Hb CS with concurrent Hb E and 3.7 deletion, and Hb CS with concurrent Hb E and 4.2 deletion [Table 4].
Table 4: Distribution of compound heterozygous Hb CS according to Hb CS genotypes and capillary electrophoresis (CE) level (N = 31).
|
Hb CS with α-3.7
|
16 (51.6)
|
0.9 ± 0.2
|
|
Hb CS with α-4.2
|
3 (9.7)
|
1.0 ±0.5
|
|
Hb CS with Hb E trait
|
7 (22.6)
|
0.4 ± 0.1
|
|
Hb CS with α-3.7 and Hb E
|
4 (12.9)
|
0.5 ± 0.0
|
Hb CS: hemoglobin Constant Spring.
*no SD because of constant value, only one sample involved.
Among the 344 heterozygous Hb CS samples, all (100%) samples were detected by CE, whereas only 290 (84.3%) samples were detected by HPLC. As for compound heterozygous Hb CS, 28 (90.3%) samples were detected by HPLC compared to 31 (100%) by CE. Only one sample of homozygous Hb CS in this study was detected by both methods [Table 5]. However, using HPLC, only a small hump was observed at the C window without quantification, especially in the case of heterozygous Hb CS.
Table 5: Detection of Hb CS by capillary electrophoresis (CE) and HPLC in study
samples (N = 376).
|
Heterozygous Hb CS
|
344
|
54 (15.7)
|
290 (84.3)
|
|
Homozygous Hb CS
|
1
|
0 (0.0)
|
1 (100)
|
Hb CS:hemoglobin Constant Spring; HLPC: high-performance liquid chromatography.
We used the Pearson’s correlation coefficient test to examine the relationship between HPLC and CE findings of Hb CS by comparing the peak value in zone 2 of CE with the small peak detected on HPLC at C window (n = 376). Table 6 shows a significant positive direct correlation between HPLC and CE value (p < 0.001). The correlation strength was good, with a positive linear relationship [Figure 2].
Table 6: Correlation of HPLC and CE value.
HPLC: high-performance liquid chromatography; CE: capillary electrophoresis.
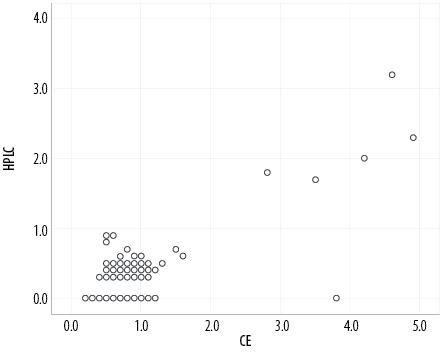 Figure 2: Scatter plot reveals the correlation between high-performance liquid chromatography (HPLC) and capillary electrophoresis (CE).
Discussion
Our study demonstrated the prevalence of Hb CS among secondary school students in Kelantan, consistent with previous findings showing that Hb CS is the most common non-deletional α-thalassemia in the Southeast Asian population.11 HRPZ II is the tertiary hospital in Kelantan that caters all the samples from secondary school students (Form four) involved in the thalassemia screening program in Kelantan. Thus, the samples included in this study are a good representation of the Kelantan population. Through the report, comprehensive data on age groups, gender, and ethnicity can be obtained. Based on 835 samples that showed peak at z one 2 CE, which can be only presumptive for diagnosing Hb CS, Malay (99.3%) is the major population affected by thalassemia, followed by female gender (54.7%).
This study observed that heterozygous Hb CS was the most common and occurred in high frequency (91.5%). A similar finding was reported by Liao et al,12 in southern China. An amount of 0.1-1.0% of total Hb, with an average of 0.6 ± 0.1%, is usually observed in a heterozygote, and this finding was quite similar to our study.7
Homozygote Hb CS shows a clinical picture of thalassemia intermedia phenotype associated with overt hemolytic anemia.13,14 Findings of a study conducted in 2012 revealed that the mean Hb CS level was significantly higher in a homozygous group than that of the heterozygous group (1.9 ± 1.8 vs. 0.4 ± 0.2; p = 0.007).9 This finding was similar to other studies, in which the homozygous group had a much higher level of CE than the heterozygous group.
Compound heterozygous Hb CS showed a lower level of zone 2, ranging from 0.2% to 1.6%, and similar finding was also reported by Ramli et al.15 They further analyzed and classified based on the genotypes: Hb CS with α-3.7 and α-4.2 deletion, Hb CS with heterozygous Hb E, Hb CS with α-3.7 deletion and heterozygous Hb E, and Hb CS with α-4.2 deletion and heterozygous Hb E.
The value of Hb CS varies depending on whether it was compounded with β-thalassemia or deletion α-thalassemia. This study showed that the Hb CS value in CE is lower if compounded with beta variant (Hb E) than in compounded with deletion α-thalassemia. The results were consistent with those of Nguyen et al,16 who reported a lower level of Hb CS (0.2 ± 0.1%) in individuals with compound heterozygous Hb CS and Hb E compared to those with compound heterozygous Hb CS and α-thalassemia, which had levels of 0.8% (for α-3.7 deletion) and 0.7% (for α-4.2 deletion), respectively.
Interactions between the different determinants of thalassemia and Hb CS can produce a broad spectrum of clinical and hematological phenotypes, ranging from normal to intermediate conditions of thalassemia.17 Association of compound heterozygous such as Hb CS with α0-thalassemia can lead to severe Hb H disease commonly encountered in China and Southeast Asia.14 In a 1997 study that compared the deletion forms of Hb H disease (--/-α) with Hb H/Hb CS (--/αCSα), the investigators reported that patients with the latter genotype were more likely to have splenomegaly or have undergone an appendectomy, and to have received transfusions.2 It appears that interactions of the non-deletion forms of α-thalassemia are associated with a more severe phenotype overall. This laboratory diagnosis is necessary for genetic counseling in regions with a high prevalence of Hb CS and α-thalassemia as couples with homozygote of Hb CS and α-thalassemia trait have a higher risk of conceiving fetuses with Hb H-CS disease than those with heterozygote of Hb CS.
Another study reported the interaction of HbE with α-thalassemia and Hb CS in a Malay family; Hb E, α0-thalassemia and Hb CS occur at significant frequencies in Malaysia, and it is not surprising to find HbE, α0-thalassemia, and Hb CS in combination.18 It is important to be aware that this combination of disorders can cause moderately severe hemolytic anemia and to ensure correct diagnosis when such patients are encountered.
Among 344 samples confirmed as heterozygous Hb CS, 290 (84.3%) samples were identified as Hb CS by HPLC. For compound heterozygous Hb CS, 28 (90.3%) out of 31 samples could be picked up by using HPLC. In this study, only one sample turned out to be homozygous Hb CS and was detected by hemoglobin analysis methods.
One study conducted in Thailand involving pregnant ladies attending antenatal clinic to evaluate the efficiency of HPLC in detecting Hb CS in peripheral blood sample reported that a small bump was present in the chromatogram at the retention time of 4–5 minutes, but it was unable to distinguish between three groups of Hb CS. All seven (100%) samples of homozygous Hb CS were able to be detected by HPLC. However, only 59 (93.2%) samples of the heterozygous group and 17 (94.1%) samples of the compound heterozygous were able to be detected in chromatogram.19 Their findings were similar to our study in which the presence of Hb CS in HPLC was either qualitatively identified or a few were quantitatively measured. In general, HPLC may be able to detect homozygous Hb CS, but it may miss heterozygous Hb CS.20 Thus, HPLC was not proposed as the primary screening tool in the thalassemia program as it has low sensitivity in detecting the carrier of Hb CS.
Even though HPLC cannot distinguish the genotypes of Hb CS between heterozygous Hb CS, homozygous Hb CS, and compound heterozygous α-thalassemia-2 with Hb CS, it is still useful for screening of Hb CS before DNA analysis. It is preferred as a screening tool as it is cheaper and more suitable to be used in centers with limited budgets.
This study also showed a good to moderate correlation between HPLC and CE findings for Hb CS detection, evidenced by good linear correlation using the Pearson correlation coefficient test. We observed that the CE patterns were easier to read than the HPLC patterns of Hb CS as there were peaks with a value in Zone 2 of CE compared to small bumps at the C window in HPLC. Furthermore, most of the samples that were detected in HPLC were without quantitative measurement. Another interesting finding showed that the value detected in CE is much higher than in HPLC.13
There were several limitations when conducting this study. Firstly, not all 835 samples with peak values in zone 2 CE were subjected to a DNA molecular study, which significantly reduced the total number of samples studied. Secondly, a larger sample size is needed especially for compound heterozygous and homozygous Hb CS for better evaluation of the difference in peak value in zone 2 of CE.
Another limitation in our study was that only one sample was confirmed to be homozygous Hb CS and showed level of 4.9% in CE. However, this method might facilitate laboratory diagnosis of heterozygous and homozygous Hb CS.
Conclusion
Automated HPLC can be used as a standard method for Hb CS identification. However, it may lead to some misdiagnosis of Hb CS. CE had a high efficacy for detecting and quantifying Hb CS, and it was superior to HPLC for detecting the heterozygous and compound heterozygous Hb CS. Integrating the results of both CE and HPLC, the diagnosis of Hb CS would likely be noticed. Hence, in a setting where DNA molecular analysis could not be carried out, the diagnosis of Hb CS can still be considered.
Disclosure
The authors declared no conflicts of interest. No funding was received for this study.
Acknowledgments
We wish to acknowledge Associate Prof Dr. Rosnah Bahar for her continuous support, the science officer, and the medical laboratory technologists in the Hematology Department of the Hospital Raja Perempuan Zainab II for their tremendous help in data collection and analysis. In addition, we thank Dr. Najib Majdi who assisted with statistical analysis.
references
- 1. Mohd Ibrahim H, Muda Z, Othman IS, Mohamed Unni MN, Teh KH, Thevarajah A, et al. Observational study on the current status of thalassaemia in Malaysia: a report from the Malaysian thalassaemia registry. BMJ Open 2020 Jun;10(6):e037974.
- 2. Wee YC, Tan KL, Chow TW, Yap SF, Tan JA. Heterogeneity in α-thalassemia interactions in Malays, Chinese and Indians in Malaysia. J Obstet Gynaecol Res 2005 Dec;31(6):540-546.
- 3. Nahanthiran S, Hafidzah N, Mustapha N, Chellappah Thambiah S, Osman M, Noor SM. Haematologic profile of haemoglobin constant spring and its co-inheritance with alpha and beta thalassaemia among form four students in Negeri Sembilan. Malaysian Journal of Medicine and Health Sciences 2022;18(SUPP21):23-29.
- 4. Jomoui W, Fucharoen G, Sanchaisuriya K, Nguyen VH, Fucharoen S. Hemoglobin constant spring among southeast Asian populations: haplotypic heterogeneities and phylogenetic analysis. PLoS One 2015 Dec;10(12):e0145230.
- 5. Shwe S, Boo NY, Ong HK, Chee SC, Maslina M, Ling MM, et al. Haemoglobin constant spring (HbA2: c.427T>C) and haemoglobin Adana (HbA2: c.179G>A) in jaundiced Malaysian term neonates with clinically significant hyperbilirubinemia. Malays J Pathol 2020 Aug;42(2):253-257.
- 6. Wee YC, Tan KL, Chua KH, George E, Tan JA. Molecular characterisation of haemoglobin constant spring and haemoglobin quong sze with a combine-amplification refractory mutation system. Malays J Med Sci 2009 Jul;16(3):21-28.
- 7. Liao C, Zhou JY, Xie XM, Li J, Li R, Li DZ. Detection of Hb constant spring by a capillary electrophoresis method. Hemoglobin 2010 Jan;34(2):175-178.
- 8. Pornprasert S, Saoboontan S, Punyamung M. Detection of Hb constant spring (HBA2: c.427T>C) heterozygotes in combination with β-thalassemia or Hb E trait by capillary electrophoresis. Hemoglobin 2015;39(3):211-215.
- 9. Pornprasert S, Panyasai S, Waneesorn J, Kongthai K, Singboottra P. Quantification of hemoglobin constant spring in heterozygote and homozygote by a capillary electrophoresis method. Int J Lab Hematol 2012 Apr;34(2):143-147.
- 10. Pornprasert S, Punyamung M. Detection of compound heterozygous of Hb constant spring and hb q-Thailand by capillary electrophoresis and high performance liquid chromatography. Indian J Hematol Blood Transfus 2015 Jun;31(2):229-232.
- Panyasai S, Pornprasert S. Detection of co-inheritance of Hb hope and Hb constant spring in three Thai samples by capillary electrophoresis. Indian J of Hematol Blood Transfus 2016;32(S1):267-271.
- 12. Liao C, Zhou JY, Xie XM, Li DZ. Screening for Hb constant spring in the Guangdong Province, South China, using the Sebia capillary electrophoresis system. Hemoglobin 2011;35(1):87-90.
- 13. Waneesorn J, Panyasai S, Kongthai K, Singboottra P, Pornprasert S. Comparison between capillary electrophoresis and high performance liquid chromatography for detection and quantification of Hb constant spring [Hb CS; α142, Term→Gln (TAA>CAA IN α2)]. Hemoglobin 2011;35(4):338-345.
- 14. Mohamed E, Nizara MI, Sabudin RZ, Camalxaman SN, Rambely AS, Haron N. Comparison between high performance liquid chromatography and capillary electrophoresis in detecting haemoglobin constant spring. Healthscope: The Official Research Book of Faculty of Health Sciences, UiTM; 2019.
- 15. Ramli M, Nik Mohd Hasan NF, Ramli M, Wan Ab Rahman WS, Hassan MN, Mohd Noor NH, et al. Significance of zone 2 peak on capillary electrophoresis in the detection of hemoglobin constant spring. Oman Med J 2023 May;38(3):e507-e507.
- 16. Nguyen VH, Sanchaisuriya K, Wongprachum K, Nguyen MD, Phan TT, Vo VT, et al. Hemoglobin constant spring is markedly high in women of an ethnic minority group in Vietnam: a community-based survey and hematologic features. Blood Cells Mol Dis 2014 Apr;52(4):161-165.
- 17. Azma RZ, Othman A, Azman N, Alauddin H, Ithnin A, Yusof N, et al. Co-inheritance of compound heterozygous Hb constant spring and a single -α(3.7) gene deletion with heterozygous deltabeta thalassaemia: a diagnostic challenge. Malays J Pathol 2012 Jun;34(1):57-62.
- 18. Ganesan J, Lie-Injo LE, Ng TS, George R. Interaction of haemoglobin E with alpha-thalassaemia and haemoglobin constant spring. Acta Haematol 1977;57(2):109-115.
- 19. Wisedpanichkij R, Jindadamrongwech S, Butthep P. Identification of Hb constant spring (HBA2: c.427T > C) by an automated high performance liquid chromatography method. Hemoglobin 2015;39(3):190-195.
- 20. Tangvarasittichai O, Jeenapongsa R, Sitthiworanan C, Sanguansermsri T. Laboratory investigations of Hb constant spring. Clin Lab Haematol 2005 Feb;27(1):
47-49.